

GOF DEBUG / INTERACTIVE NETLIST SCHEMATIC
Large netlist.
Clear schematic. Fast answers.
See the logic behind your signals. GOF Debug lets IC designers build schematics dynamically, make GUI ECOs on the fly, and trace deep clock buffer paths—in the same visual workspace.
01 / DYNAMIC SCHEMATIC
The report names an instance.
See the logic around it.
In a large netlist, a debug investigation often starts with one instance:
- DFT DRC: trace the flagged instance in the schematic to understand the violation. Once the required fix is clear, make the ECO right there—see ECO on the fly in Figure 2.
- Timing analysis: excessive delay through a cell contributes to a timing violation.
- Gate-level timing simulation: a timing check reports a violation at a flip-flop instance.
That instance may be buried many levels deep in the design hierarchy. Tracing its connections through module definitions and port mappings in a text editor is slow and difficult.
With GOF Debug, copy the full instance name from the report and use Ctrl + g to open it in a schematic. Expand its drivers and loads with mouse clicks to inspect the surrounding logic and understand the reported issue.
Watch Figure 1: a single flip-flop grows into a connected schematic as the user expands its input and output paths.
Explore the schematic tools in the manual →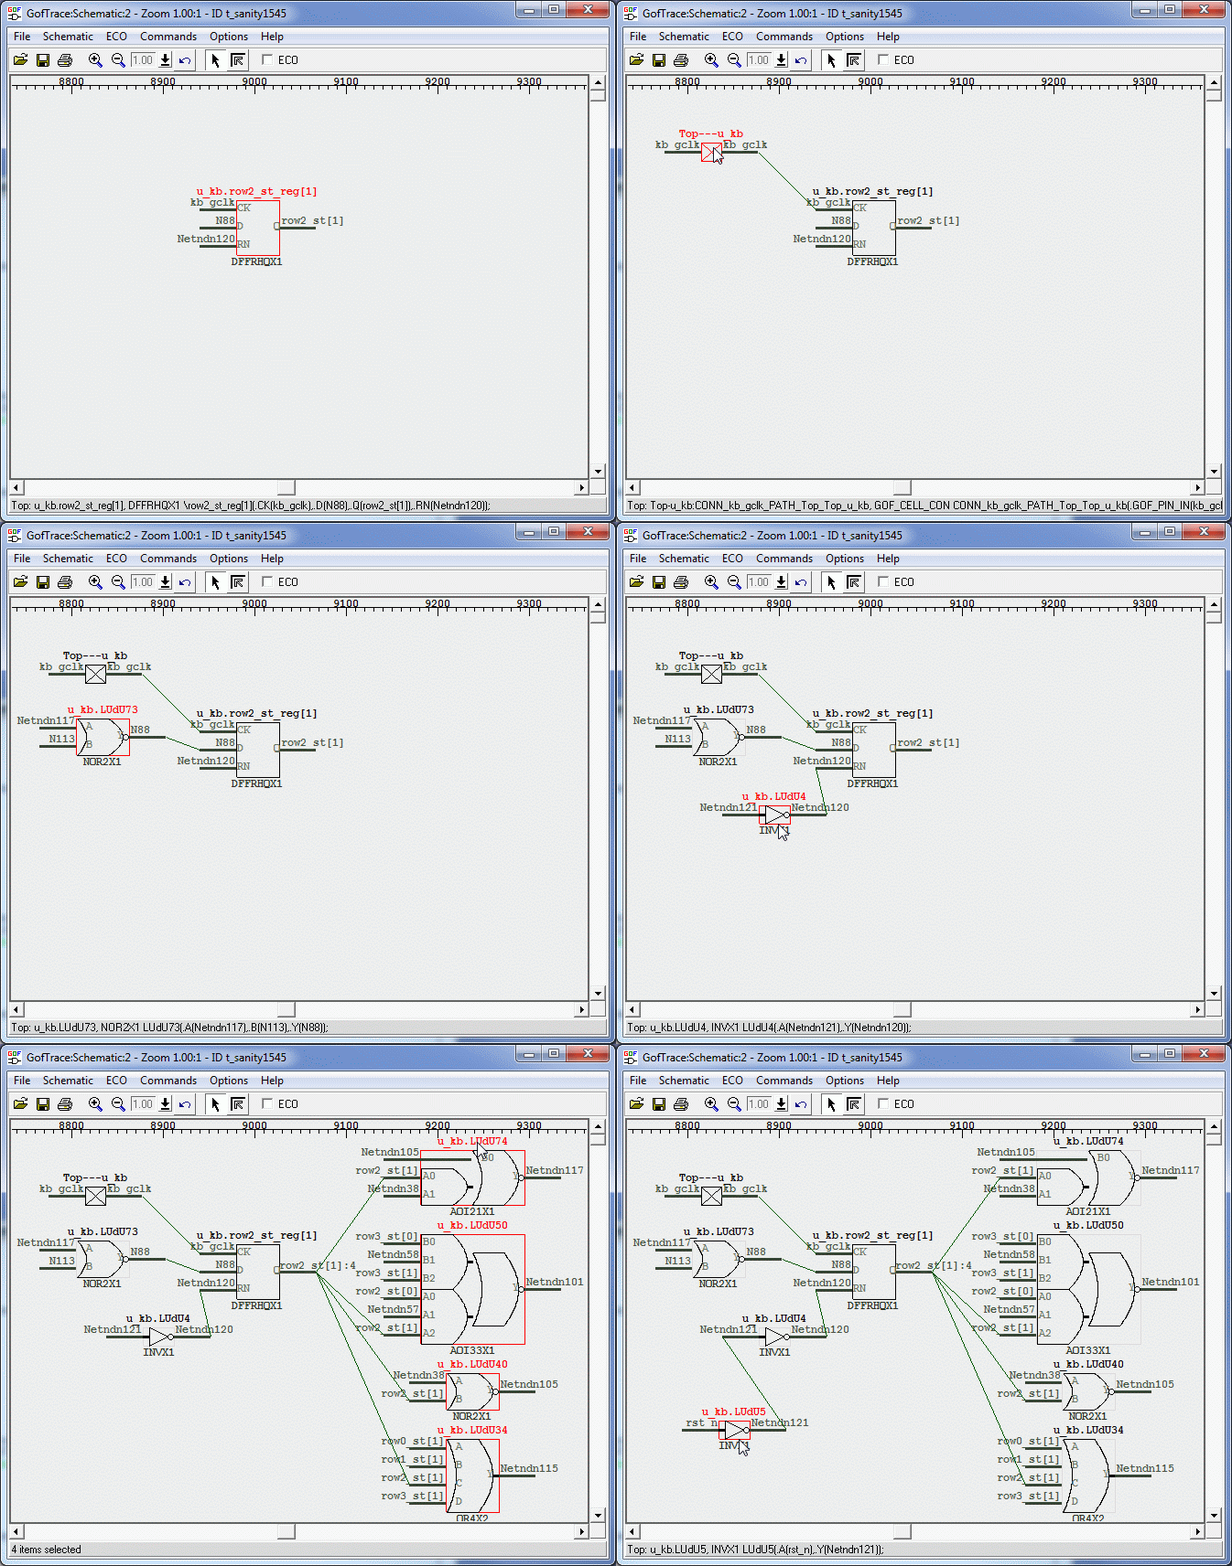
02 / GUI ECO
Find the cause.
Fix it in the same schematic.
After tracing an instance flagged by DFT DRC, you can move straight from understanding the issue to making the required logic change. Enable ECO mode in the same schematic, insert a gate or reconnect pins, and inspect the updated connections on the fly.
Debug and ECO in one schematic. This is a key advantage of GOF Debug: the circuit context you used to diagnose the problem becomes the workspace for the fix.
Watch Figure 2: the user inserts a NAND gate into an existing path and connects another signal to its input, building the ECO on the fly.
Explore GUI ECO in the manual →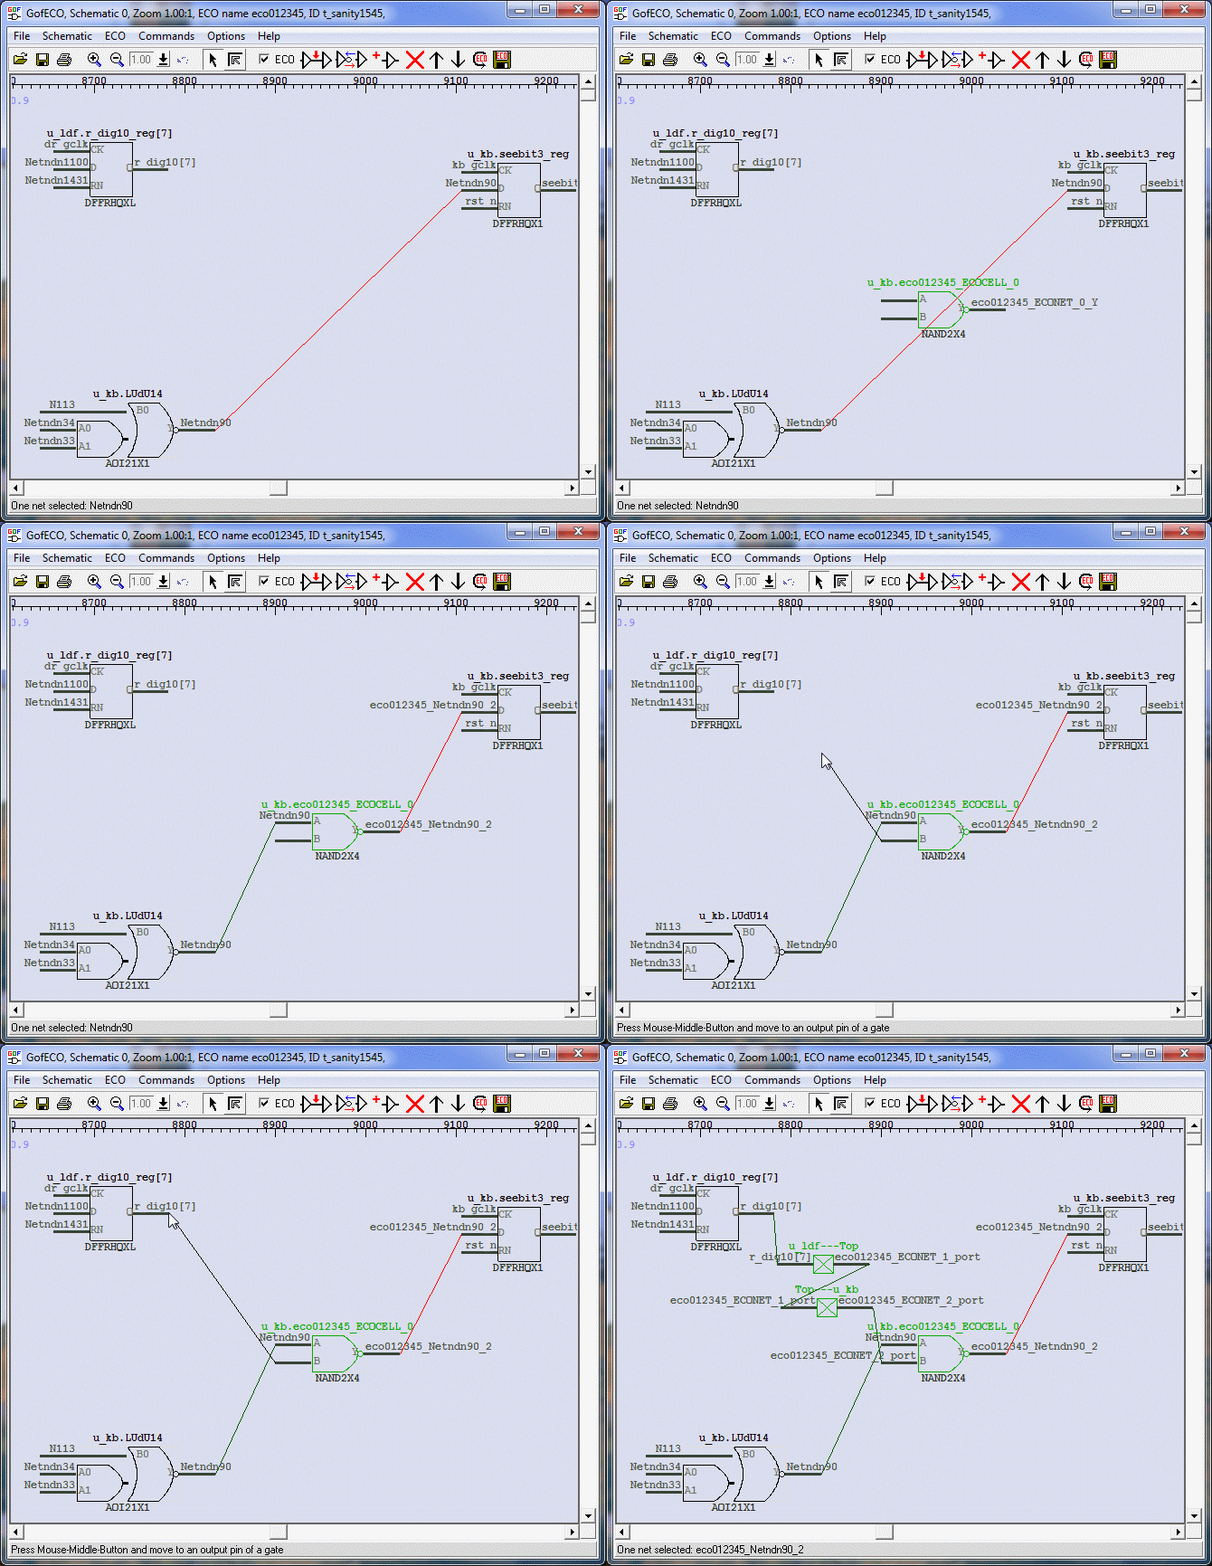
03 / CLOCK TREE DEBUG
Trace deep clock trees.
Skip the repetitive clicks.
Finding the source of a clock in a huge buffer tree can mean following stage after stage. GOF Debug automates that upstream trace.
Select a flip-flop’s clock input and choose Driver Until Non Buffer. GOF follows the buffer and inverter chain until it reaches a non-buffer/inverter driver, drawing the path for inspection.
Watch Figure 3: one command expands the clock input’s upstream buffer path. The trace follows the selected path through the tree.
Read the clock tracing workflow in the manual →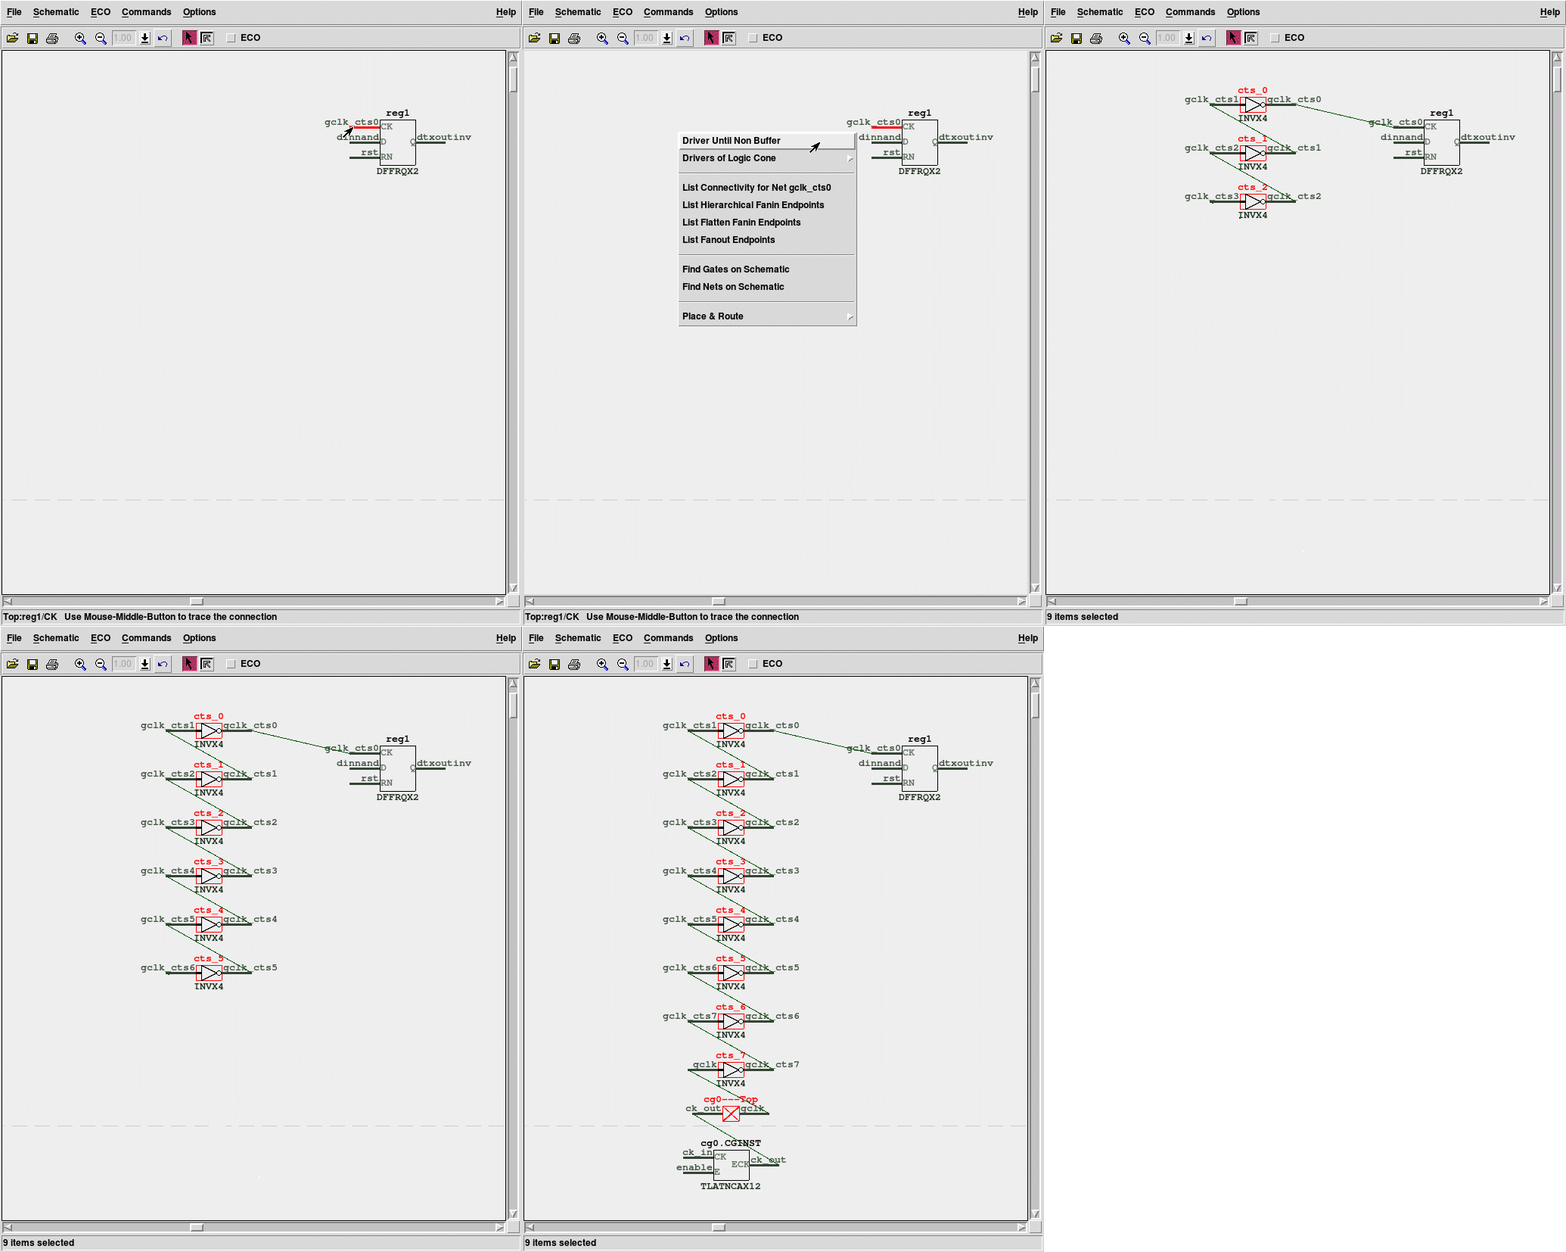
BEYOND THE THREE DEMOS
More context for your netlist investigation.
- Fanin and fanoutExplore logic cones and trace driver/load connections.
- Net equivalenceCheck net equivalence from the schematic.
- Physical contextLoad DEF and LEF to inspect floorplan and placement.
PUT GOF DEBUG TO WORK
Bring your next netlist debug question.
Explore a logic cone, make a small ECO, or trace a clock path. Request a license to evaluate GOF Debug in your design flow.