GOF Formal is one of the function components integrated in GOF platform. It provides a formal method to calculate fault coverage in an IC design in functional safety.
ISO26262 defines functional safety as "the absence of unreasonable risk due to hazards caused by malfunctioning behavior of electrical and electronic systems". Four ASILs are proposed to represent four degrees of automotive hazards. In IC component, the coverage in the ASIL requirement is the fault coverage in the logic circuit. Specifically, single point fault metric (SPFM) and latent fault metric (LFM) should meet minimum numbers for the corresponding ASIL levels. The following table lists the three ASIL levels with specific coverage numbers defined in the standard.
| ASIL | SPFM | LFM |
|---|---|---|
| B | ≥90% | ≥60% |
| C | ≥97% | ≥80% |
| D | ≥99% | ≥90% |
The traditional method to calculate the fault coverage is pure simulation based. It's inefficient and time consuming. GOF Formal provides a formal and efficient way to calculate the SPFM and LFM numbers of a logic design. It can work in a standalone mode to calculate the coverage metric. And it can also work as a supplemental method to cover the faults left over from simulation based process.
Single point fault (SPF) is the fault in the IC design that leads directly to the violation of a safety goal which is defined as observation point in the "Cone of Influence" section below and no fault in the IC circuit is covered by any safety mechanism. However, if there is safety mechanism, but the fault can't be covered by the safety mechanism, the fault is called residual fault according to the standard. In calculating SPFM, residual fault is treated as single point fault. Latent faults are multiple-point faults not detected by a safety mechanism or perceived by the driver. The latent fault metric is to determine whether coverage by safety mechanisms is sufficient to protect against risk from latent faults in the IC design.
GOF Formal injects faults to each input port and each pin of logic gates. Each input port has stuck-at 0 and stuck-at 1 faults injected. Every combinational gate has stuck-at 0 and stuck-at 1 faults injected into each pin. For flip-flop, stuck-at 0 and stuck-at 1 faults are injected into each data and clock pin. And flip-flop has Single Event Upset (SEU) fault injected to the state in random time.
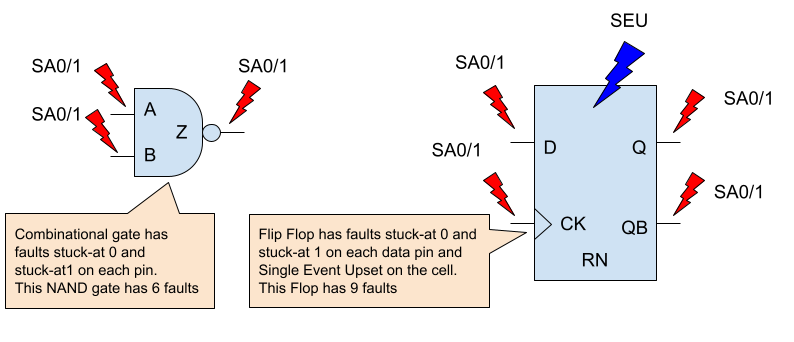
Figure 1: Fault model for logic gates
SPFM and LFM metrics can be calculated in two methods, rough mode and detail mode. The rough mode is done by structural analysis of the Cone of Influence. The detail mode is calculated by formal analysis of the Cone of Influence.
Two types of strobing points shall be defined for the Cone of Influence extraction.
The observation points are the outputs or registers that are impacted by the injected faults which affect functional safety and violate safety goal. The diagnostic points are the outputs or registers to check if injected faults can be detected at these strobing points or perceived by the up level driver.
The logic back traced starting from the observation points and the diagnostic points all the way to the inputs or black boxes. The Cone of Influence (COI) is created for the observation points and the diagnostic points respectively. Each cell and each input port in the cones will be injected faults according to the Fault Model section.
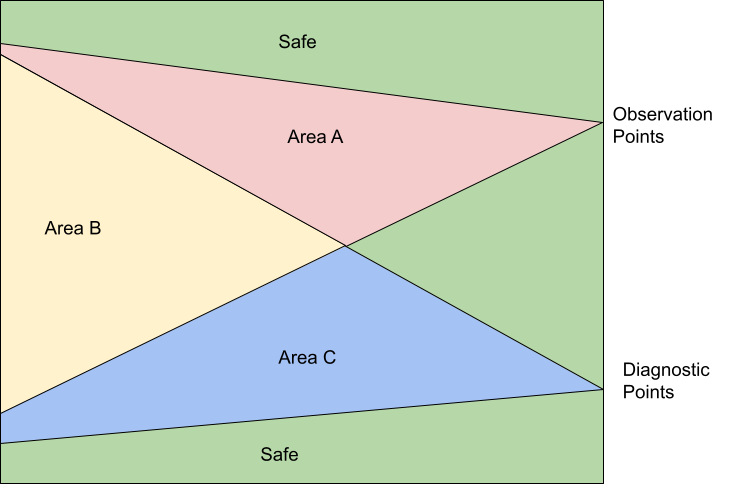
Figure 2: Cone of Influence
In Figure 2, all faults that are outside of the two COIs are safe faults.
Area A has faults that are observable but not detectable, so they can be classified as residual faults. And they are called single point faults if safety mechanism is not implemented for the design, in which case the diagnostic points are not present and Area B and Area C are zero size. However, if they don't propagate to the observation points in the detail formal COI analysis, they can be classified as multiple point faults. For example, TMR is implemented on Area A. The majority faults in this area will become multiple point faults.
Area B has faults that are classified as multiple point faults, since they are observable and detectable. In the rough structural COI analysis, the worst SPFM metric can be calculated by assuming them as all residual faults and the best SPFM metric by assuming them as propagatable to the diagnostic points. So the detail formal COI analysis will determined the fault classification.
Area C has faults that are classified as detectable multiple point faults, but they are not observable. The detail formal COI analysis will be run on Area C to check if the faults in this area can not propagate to the diagnostic points, then they can be classified officially as latent faults. The best and worst LFM metrics can be gained by the rough structural COI analysis method.
The Single Point Fault Metric (SPFM) can be calculated according to the following equation.
SPFM = 1 - Σ(λSPF+λRF)/Σ(λ)
where:
λSPF: Single Point Fault when there is no safety mechanism
λRF: Residual Fault
λ: Any Fault
The Latent Fault Metric (LFM) can be calculated according to the following equation.
LFM = 1 - Σ(λMPF_UD)/Σ(λMPF - λSPF - λRF)
where:
λMPF_UD: Multiple Point Fault not detected by the driver
λMPF: Any Multiple Point Fault
λSPF: Single Point Fault when there is no safety mechanism
λRF: Residual Fault
In the rough method calculation by analyzing COI structure, the best and worst metrics can be quickly calculated.
In the example shown in Figure 3, the faults are distributed as:
The best SPFM assumes the faults in Area B are propagatable to the diagnostic points. The single-point/residual faults Σ(λSPF+λRF) has number 122 only in Area A. Therefore, the best case SPFM is 97.3%.
The worst SPFM assumes the faults in Area B are all residual faults, so Σ(λSPF+λRF) has number 1330 which is 1208 plus 122, and get calculated metric to be 70%.
The best LFM assumes the faults in Area C are all detectable. Σ(λMPF_UD) is zero, So LFM is 100% in the rough structural COI analysis.
The worst LFM assumes the faults in Area C can not propagate to the diagnostic points, and they are not detectable. Therefore, Σ(λMPF_UD) has the number of 2582, and the worst LFM is 59.5%.
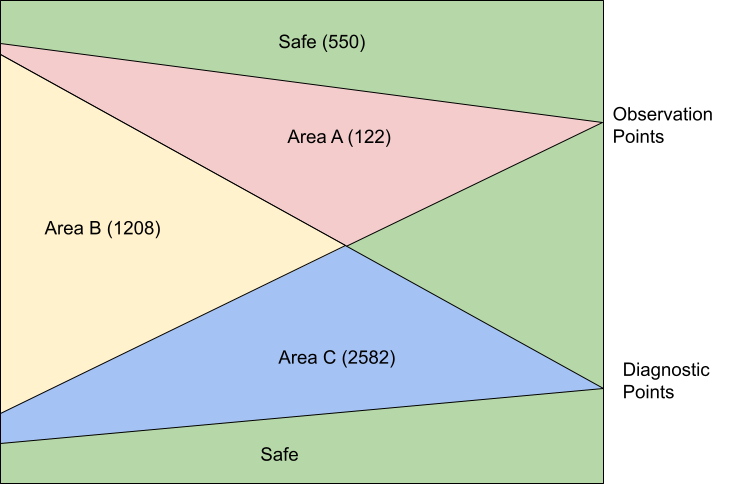
Figure 3: Example fault numbers in COI
The formal COI analysis needs to be run to get the final accurate metrics. For each fault injected, GOF Formal either proves that a path exists to propagate the fault to the observation or diagnostic points, or disprove there is such path. A path means by toggling input ports in some limited clock cycles, the fault can propagate to the observation/diagnostic points.
GOF Formal doesn't require stimulus nor is a testbench required. The tool automatically determines the stimulus. For each fault injected, two designs are compared to see if the specified outputs are equal. One design is the fault injected design, the other is the original design. The specified outputs are the observation points or the diagnostic points set by user. The faults to be injects can be thousands or millions. GOF Formal uses cluster command to fully utilize the cluster computing power. Thousands of jobs can be submitted in parallel to the cluster machines with only one license being used.
After the detail formal COI analysis of the above example, the residual fault number is 178, and the final SPFM is 96%. The latent fault number is 260, so the final LFM is 94%.
In order to improve the fault coverage, safety mechanisms should be built in the IC design. There are several approaches for safety mechanism implementation.
In Figure 3, a safety mechanism can be a double modular design or ECC design. The diagnostic points would be the alarm bits in the double modular error bit, or ECC error recovering signals. For SPFM metric improvement, those gates in Area A that are not covered by safety mechanism can be modified to support TMR (Triple Module Redundancy), so that λSPF can be further reduced and SPFM improved accordingly. See this TMR ECO Case
Please see GOF Formal Use Cases for more information.
For other usages and flows, check Online Manual for more detail