In fault injection verification, user may have interest in how the fault propagates to a specified output port. GOF Formal can run fault verification and dump the signal activities to show the path that the fault propagates to the output port.
The following script is to setup the fault and dump signal activities to a VCD file:
set_log_file("obsv_one_fault.log");
read_library("art.5nm.lib");      # Read in liberty file
read_design('-imp', 'ecc_process.v'); # Read in the design block
set_top("ecc_top");               # Set the top module name
set_pin_constant("test_mode", 0); # Set pin constraint
set_observe_points("sb_err_o");   # Set the observe point to sb_err_o
verify_faults("U158/Y:0", "-vcd", "debug.vcd");   # Check if the stuck-at 0 fault can be observed in sb_err_o
read_vcd("debug.vcd");
sch("sb_err_o");
gexit;
The dumped VCD is read back by read_vcd command. And GOF Incremental Schematic is enabled to trace the output port sb_err_o.
When the output cell shows on the schematic, use mouse middle button clicking on the cell input pin to expand the schematic. Refer to Incremental Schematic for more detail usage.
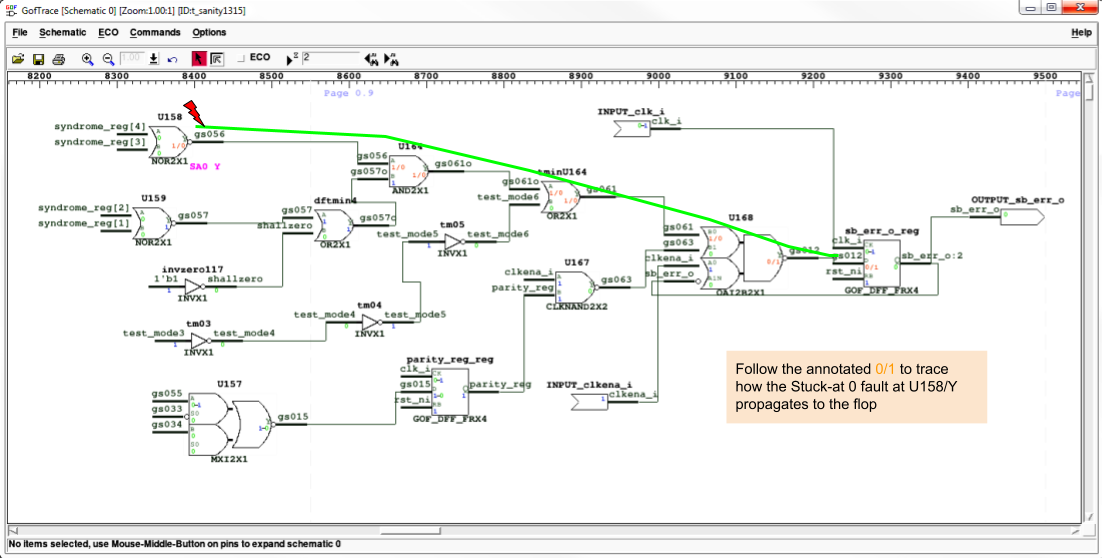
Figure 1: Fault propagation frame 1
User can click on the pin that has 0/1 or 1/0 as annotated value which means the fault makes the logic have different value at the current clock cycle.
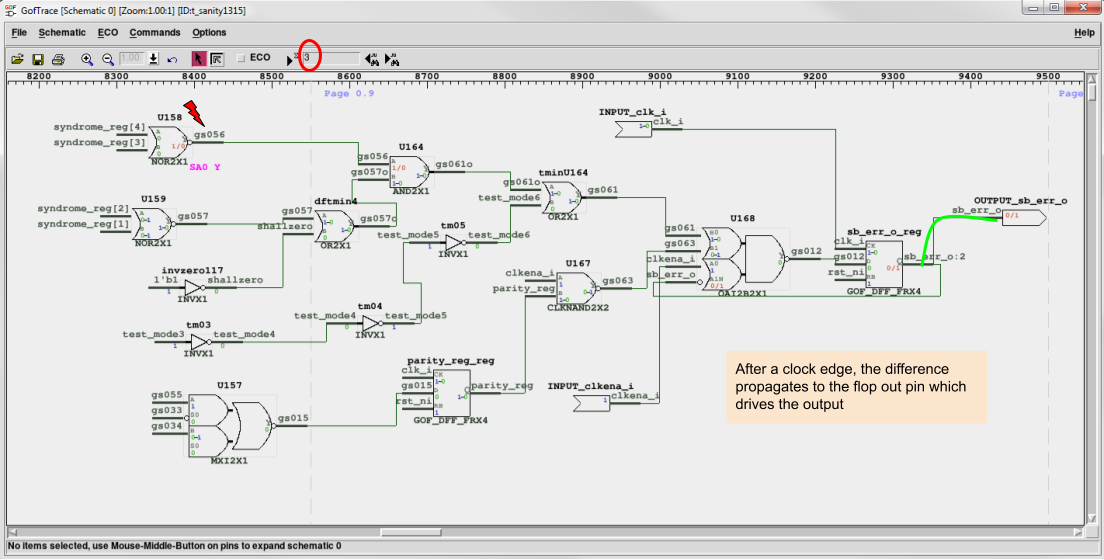
Figure 2: Fault propagation frame 2
Click the clock edge navigator to show the annotating status in next or previous clock cycle.